

Supervisor: Michael Reiter, Florian Kowarsch
Background
Flow Cytometry is a laser-based technique to measure antigen expression levels of blood cells. It is used in research as well as in daily clinical routines for immunophenotyping and for monitoring residual numbers of cancer cells during chemotherapy. One patient’s sample contains approximately 50-300k cells (also called events) with up to 15 different features (markers) measured. Each feature corresponds to either physical properties of a cell (cell size, granularity) or to the level of expression of a specific antigen marker on the cell’s surface.
In a process called Gating medical experts draw several polygons among different cell populations on 2D plots in order to hierarchically sub-select and track down cancer cell populations. For instance, usually on the first plot measuring artifacts are excluded. The resulting data is further filtered by selection certain cell populations based on their biological features. This process is repeated until the filtered data only consists of cancer cells. These annotations are used as ground truth to train automated prediction models. 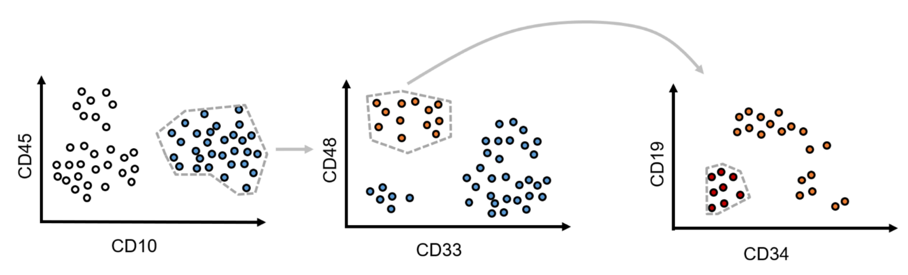
Figure 1: Process of manual “gating”
Problem Statement
Deep Convolutional Neural Networks such as ResNets have proven to be highly effective on spatial data like images or audio. Since human experts successfully identify cancer cell populations in a Flow Cytometry sample using a combination of 2D plots, it therefore is a legitimate way to also process Flow Cytometry samples as 2D images for automated analysis with Convolutional Neural Networks.
Dataset
Over 600 samples from Acute Lymphoblastic Leukemia (ALL) patients as well as over 70 Samples from Acute Myeloid Leukemia (AML) are available.
Goal
The goal of this work is to develop a deep convolutional neural network that is capable of identifying cancer cell populations in the given Flow Cytometry data. In order to apply a CNN on this task the input data can either a) be converted into a set of 2/3D images or b) binned into a n-dimensional data structure. The network output should either c) be classes assigned to each cell (cancer cell or not) or d) a set of points that represent the polygons as used be the medical experts to identify clusters.
Workflow
Literature research
Implementation in Python
Evaluation
Written report or thesis (in English) and final presentation
Requirements
Python
Basic knowledge in Deep Learning (PyTorch, Tensorflow) and Machine Learning