
Supervision
Michael Reiter, Roxane Licandro
Problem Statement
Acute Leukaemia is a disease induce by genetic alterations of blood progenitor cells, which influences the blood generation process (haematopoiesis) and leads to the proliferation of undifferentiated (leukaemic) cells. Flow CytoMetry (FCM) measurements are used to reliably assess these cancer cells (blasts) and to quantify their ratio to the whole cells observed, which is also called the Minimal Residual Disease (MRD). It is a powerful predictor for treatment response, and thus, used as diagnostic tool for planning patient’s individual therapy. Currently, the quantification of MRD is performed manually using a gating procedure. Therefore, operators are observing two dimensional FCM plots (cf. Figure 1) and drawing polygons on populations of interest. It is performed using a defined hierarchy and sequence of features observed in the plots.
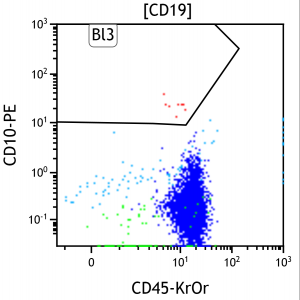 Figure 1. Manual estimation of blast populations (red) in a two dimensional FCM plot. CD10 and CD45 are antibodies marked with the fluorochromes PE and KrOr, which expression is a measurable feature of a blood cell (one point in the figure). 10 to 15 different features are measured of a cell at once with a FCM.
Within the ongoing European project AutoFLOW at the Computer Vision Lab automatic gating procedures for Acute Lymphoblast Leukaemia is developed with the aim to obtain objectivity in the gating procedure, to increase comparability and to provide a robust automatic MRD assessment methodology. The challenge within the automated gating is to detect even small leukaemic populations (~10-20 leukaemic cells) among 300.000 up to 1.000.000 cells.
Identifying biologically meaningful cell sub-populations is essentially a clustering problem, however, standard clustering methods are impracticable, because size, shape and location of corresponding clusters may vary strongly between samples due to phenotypic differences, inter-laboratory variations, and variations which are inherent in the data acquisition process.
Goal
Provide a motivated solution to normalize the representation of FCM data from different machines and laboratories and compare the proposed method against state of the art. Thus, the tasks are as follows:
- Creation of training and evaluation data set
- Learning of a Gaussian Mixture Model based representation of the data
- Implementation of different automatic normalization techniques
Application of methods to choose the suitable algorithmic parameter as well as choosing optimal modelling parameters to optimize a registration procedure - Evaluation, visualisation and comparison of the result to expert results.
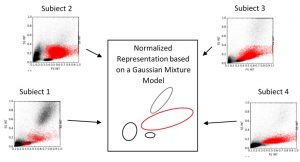 Figure 2. Schematic illustration of a normalized representation using a Gaussian Mixture Model. Samples from 4 different subjects are visualised, showing different appearances of blast populations (red) and non-blast blood cell populations (black). For visualisation purpose only two dimensions of the high-dimensional feature space are shown.
Workflow
- Literature research on existing methods data normalisation and feature based registration
- Get familiar with FCM data (Reading routine, data analysis)
Development of a data normalising procedure - Data representation using a Gaussian Mixture Model
- Designing of a registration procedure for normalized representation
- Evaluation of the system proposed
- Written report/thesis (in English) and final presentation
References
1. K. Lo, R. Brinkman and R. Gottardo, “Automated gating of flow cytometry data via robust model based clustering”, Cytometry Part A, 73(4): 321-332.
2. Bashashati and R. Brinkman, “A survey of flow cytometry data analysis methods”, Advances in Bioinformatics, Article ID 584603, pp.1-19, 2009.
3. N. Aghaeepour, G. Finak, H. Hoos, T. R. Mosmann, R. Brinkman, R. Gottardo, and R. H. Scheuermann, “Critical assessment of automated flow cytometry data analysis techniques”, Nature Methods, vol. 10, no. 3, pp. 228–238, Mar. 2013.
4. M. Reiter, P. Rota, F. Kleber, M. Diem, S. Groeneveld-Krentz, M. Dworzak, “Clustering of cell populations in flow cytometry data using a combination of Gaussian mixtures”, Pattern Recognition, vol. 60, pp. 1029-1040, Dec. 2016.
5. A. Bashashati and R. Brinkman, “A survey of flow cytometry data analysis methods.” Advances in bioinformatics, vol. 2009, pp. 584 – 603, 2009.
6. S. Pyne, X. Hu, K. Wang, E. Rossin, T.-I. Lin, L. Maier, C. Baecher-Allan, G. McLachlan, P. Tamayo, D. Hafler et al., “Automated highdimensional flow cytometric data analysis,” Proceedings of the National Academy of Sciences, vol. 106, no. 21, pp. 8519–8524, 2009.
7. M. Brüggemann, A. Schrauder, T. Raff, H. Pfeifer, M. Dworzak, O. Ottmann, V. Asnafi, A. Baruchel, R. Bassan, Y. Benoit, A. Biondi, H. Cavé, H. Dombret, A. Fielding, R. Foà, N. G¨okbuget, A. Goldstone, N. Goulden, G. Henze, D. Hoelzer, G. Janka-Schaub, E. Macintyre, R. Pieters, A. Rambaldi, J.-M. Ribera, K. Schmiegelow, O. Spinelli, J. Stary, A. von Stackelberg, M. Kneba, M. Schrappe, and J. van Dongen, “Standardized MRD quantification in European ALL trials: proceedings of the Second International Symposium on MRD assessment in Kiel, Germany, 18-20 September 2008.” Leukemia: official journal of the Leukemia Society of America, Leukemia Research Fund, U.K, vol. 24, no. 3, pp. 521–535, 2010.
8. C.-H. Pui, L. Robison, and A. Look, “Acute lymphoblastic leukaemia”, The Lancet, vol. 371, no. 9617, pp. 1030–1043, 2008.
9. C. M. Bishop, Pattern recognition and machine learning. Springer, 2006.